Understanding and Reading Candlestick Patterns
📊 Understanding how to read charts is a critical component for any trader. I thought I would post some insights into how to start reading charts and today I am looking at candlestick patterns and how to analyse them.
🕯️Candlestick patterns are like the language of the financial markets, conveying crucial information about price movements and market sentiment. Whether you’re an experienced trader or just starting out, mastering these patterns can significantly enhance your ability to analyze and predict market trends.
🧠 One of the key aspects of candlestick patterns is their ability to provide insights into market psychology and the balance between buyers and sellers. By studying the various shapes and formations of candlesticks, you can glean valuable clues about the future direction of prices.
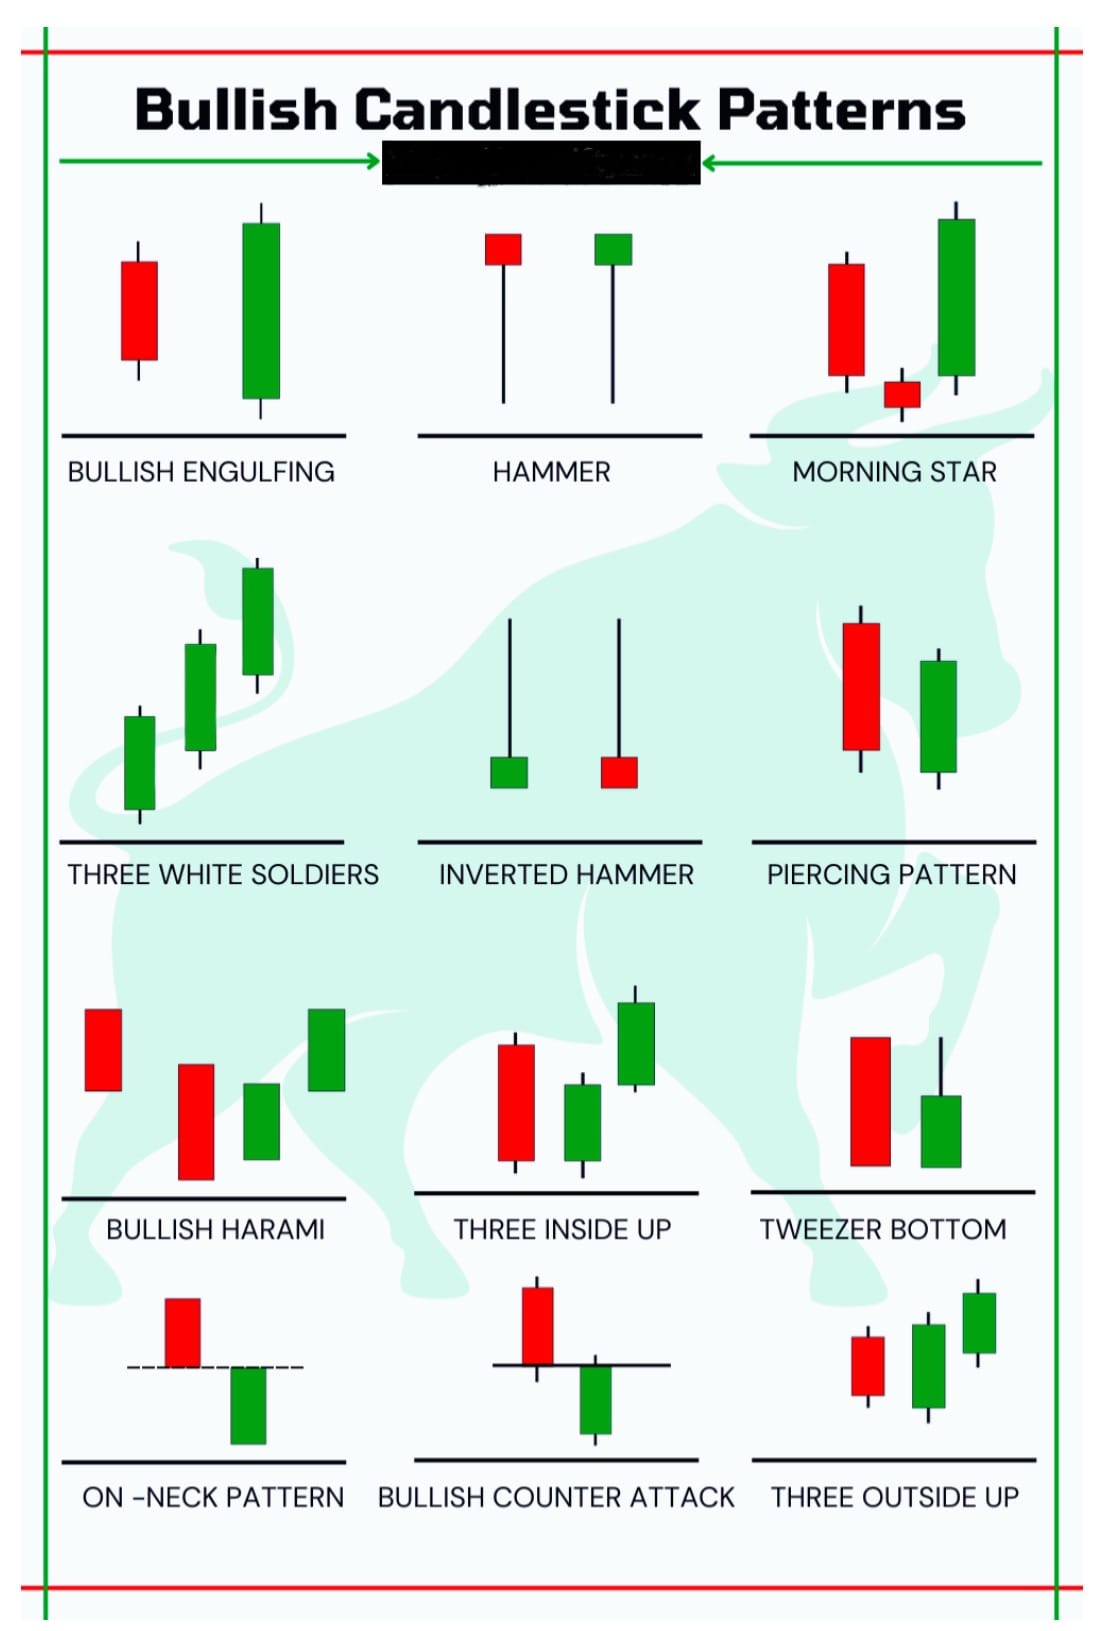
⚒️ For example, patterns like the “hammer” or “doji” signal potential trend reversals. A hammer occurs when the price opens significantly lower than its close, but rallies to close near its high. This suggests that buyers are stepping in to push prices higher after a period of decline, potentially signaling a bullish reversal.
🥋 Similarly, a doji occurs when the open and close prices are virtually the same, indicating indecision in the market. This could signal a potential reversal or a period of consolidation before the next significant move.
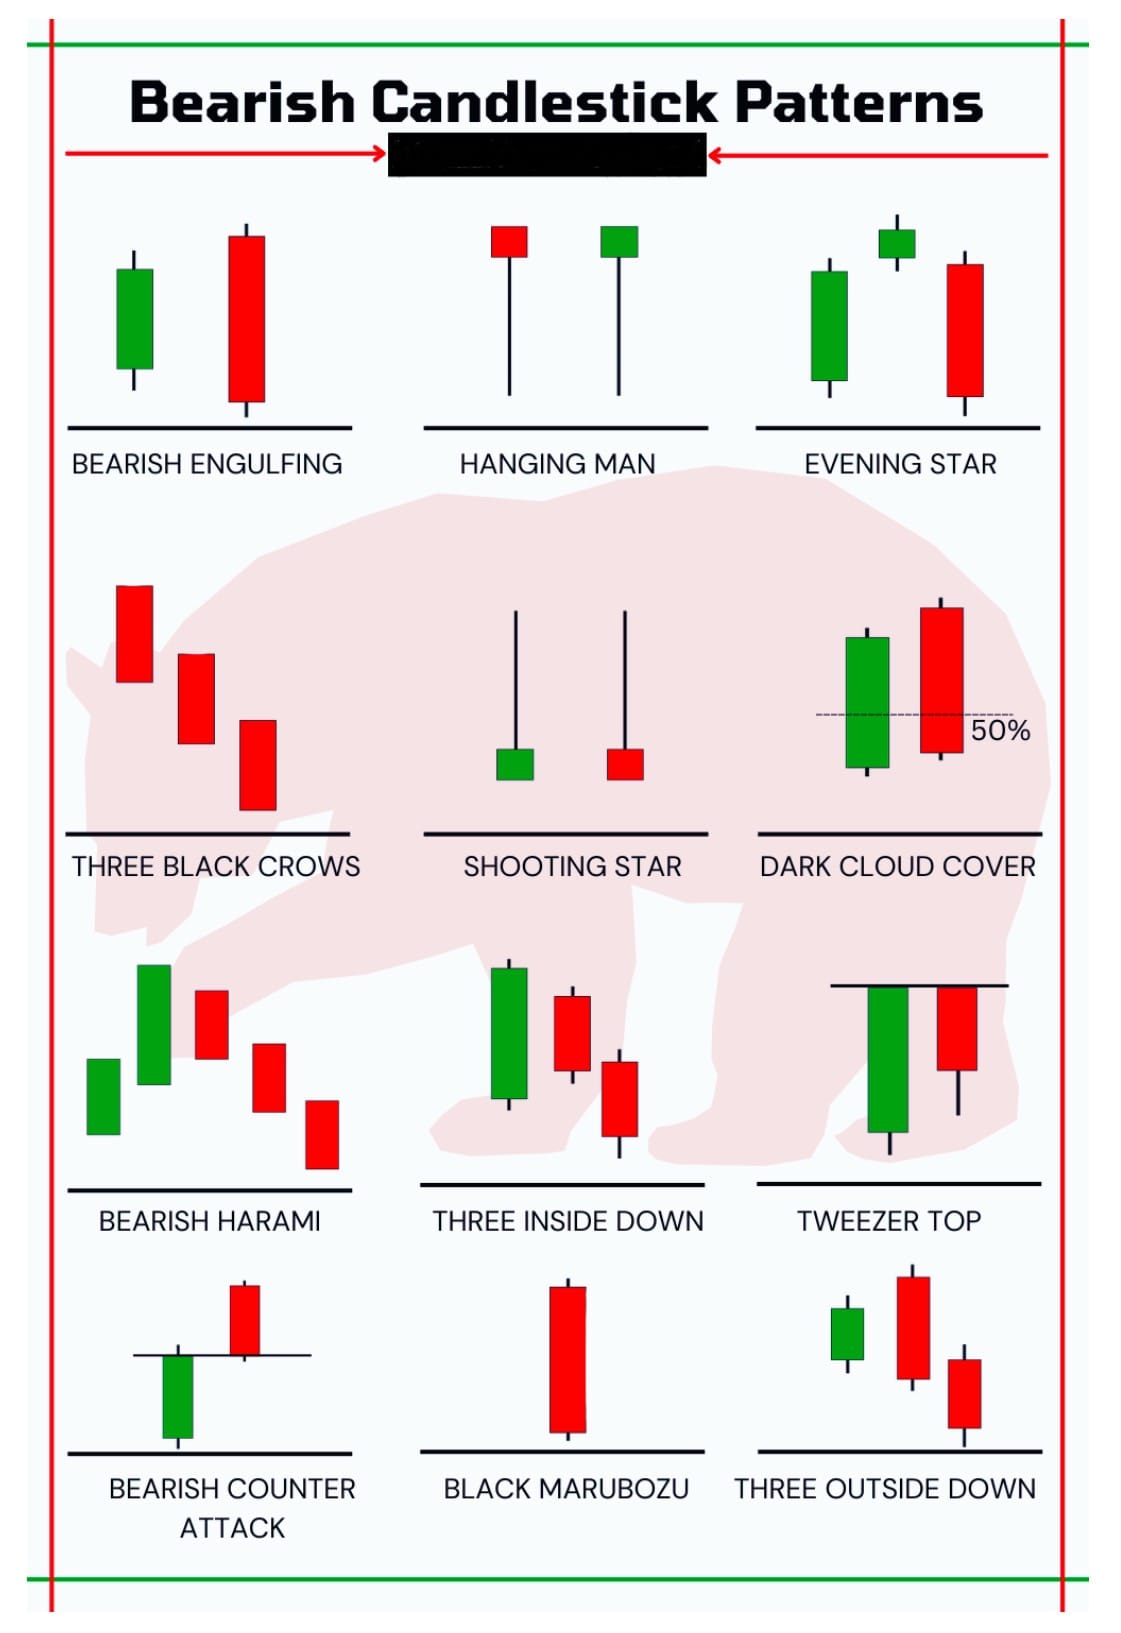
🌟 Other patterns, such as “engulfing” patterns or “morning star” formations, provide insights into shifts in market momentum and sentiment. An engulfing pattern occurs when a candlestick completely engulfs the previous candlestick, indicating a strong reversal in momentum.
🌅 The morning star pattern, on the other hand, consists of three candlesticks – a long bearish candle, followed by a small-bodied candle or doji, and then a long bullish candle. This pattern suggests a potential reversal from a downtrend to an uptrend.
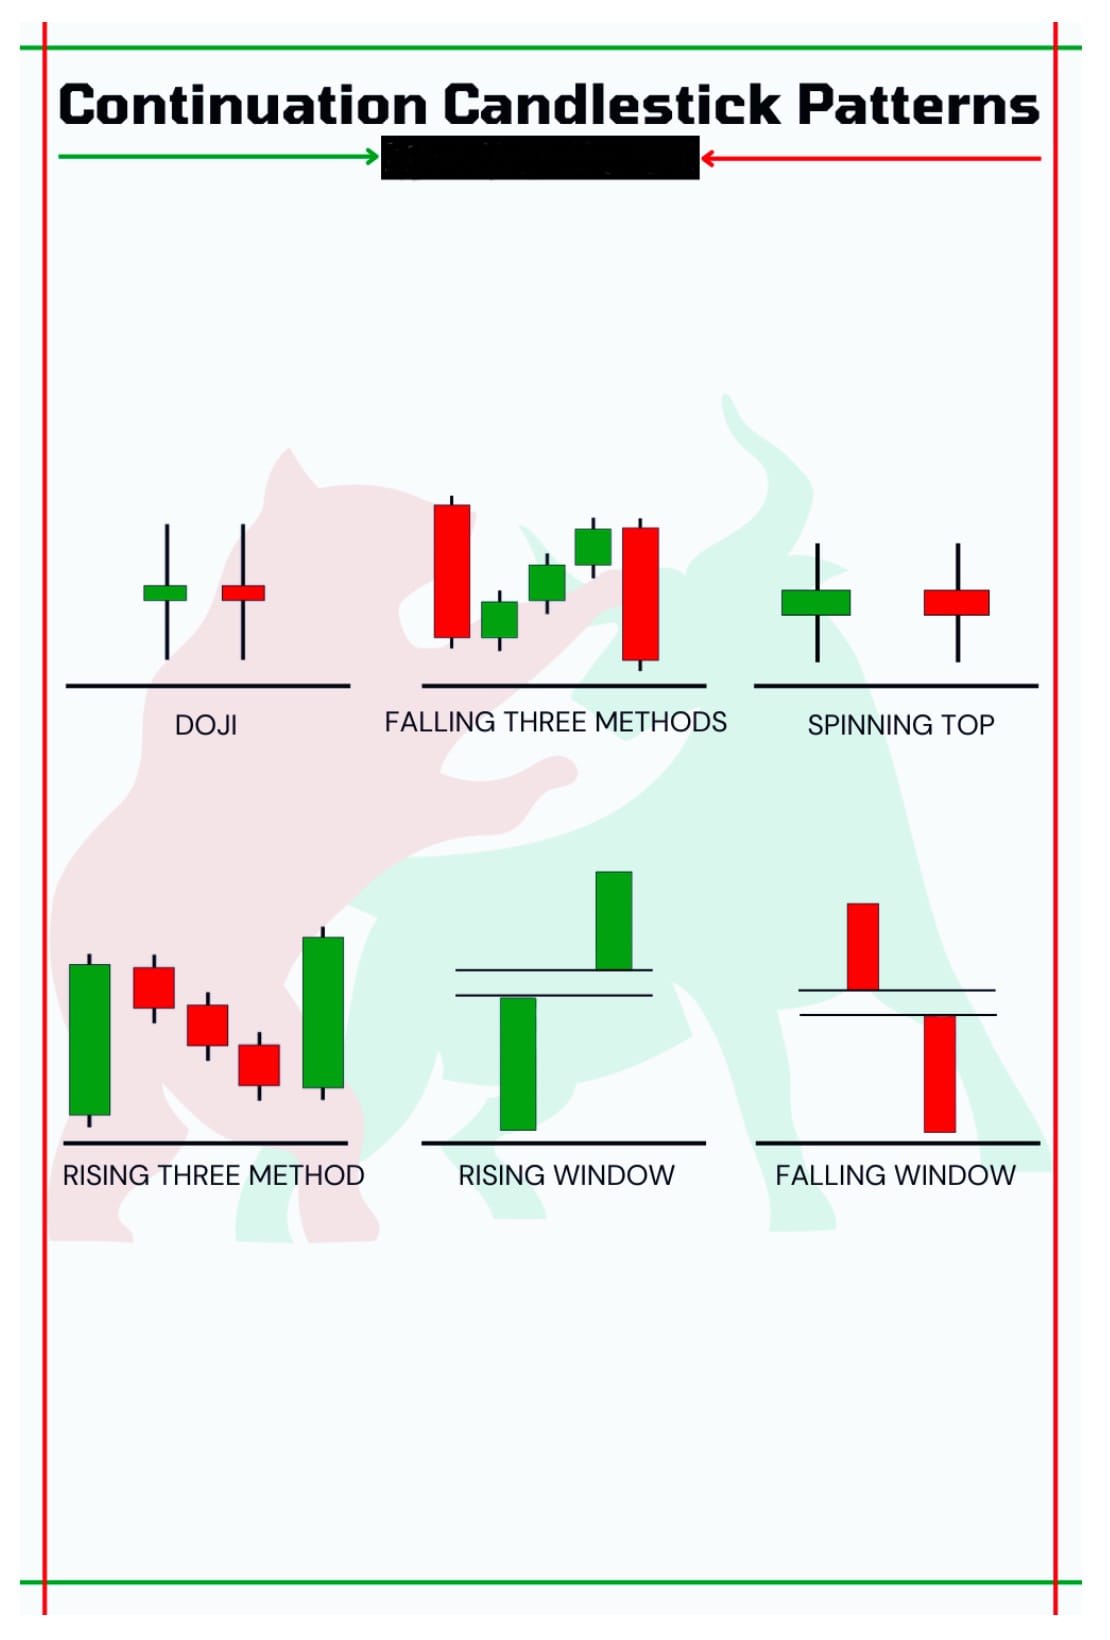
📈 By recognising these patterns and understanding their significance, you can make more informed decisions about when to enter or exit trades, manage risk, and capitalise on potential opportunities in the market.
⚠️ However, it’s important to note that candlestick patterns should not be used in isolation. They are most effective when combined with other technical indicators and analysis techniques to confirm signals and validate trading strategies.


